
Understanding Private Capital’s Exposure to Carbon-Intensive Sectors
Rumi Mahmood, MSCI
Abdulla Zaid, Burgiss
Key Takeaways:
Real-asset companies were substantially more exposed to the carbon-intensive energy and utilities sectors than other private asset classes. Nearly 32% of the asset class’s underlying holdings valuation were in these two sectors.
Private equity was the least exposed to carbon-intensive sectors.
Three of the five most carbon-intensive sub-industries were in utilities, with independent power producers exhibiting 79 times more carbon intensity than the average for all sectors.
Between the growing body of global regulations and voluntary commitments by investors to set carbon-reduction targets, carbon-emission disclosures have become critical to investors. While in public markets, such disclosures have increased, estimations can help bridge the gap in the private space, where transparency is lacking as investors evaluate their exposures when making decisions about portfolios.
MSCI partnered with Burgiss to examine the estimated Scope 1 and Scope 2 carbon emissions of 1,625 companies across the carbon-intensive energy, materials and utilities sectors. This included 1,280 private-equity and -debt, real-asset and generalist funds. Carbon intensity estimates were calculated only for companies within the private capital universe. Therefore, properties, natural resource investments, and infrastructure assets generally do not have an estimate available yet. We then examined these estimates to find informative trends for investors by asset class and at the sector and sub-industry levels.[1]
All high-emission sectors are not created equal
At the sector level we found that not only were energy, materials and utilities firms the dominant emitters in the private space, but the average emissions intensity of utilities alone dwarfed the remaining Global Industry Classification Standard (GICS®)[2] sectors by a factor of 21. Also of note, we saw that energy, while often at the forefront of emissions scrutiny, ranked lower than both materials and utilities.
The utilities sector had the highest levels of Scope 1 and Scope 2 carbon intensity

Data as of the third quarter of 2021. This analysis was based on the aggregated underlying holdings’ valuation of USD 231 billion held across 1,625 companies (571 in energy, 837 in materials and 217 in utilities) in 1,280 funds. The turquoise and yellow bars represent quartiles of company carbon-intensity distributions, the midpoint between them being the median. The error bars at the top and bottom represent the 5th and 95th perentiles of carbon intensity for each sector. Source: MSCI ESG Research LLC, Burgiss
Real-asset and distressed-debt funds had some of the greatest exposure to high-emitting sectors
Comparing exposures across all private asset classes, we found that real assets had the largest exposure to energy by far, and was more exposed to the utilities sector than either private equity or debt. Distressed debt, on the other hand, was the most-exposed asset class to materials.
Real assets had the greatest allocation to energy by far

Data as of the third quarter of 2021. This analysis was based on the aggregated underlying holdings’ valuation of USD 231 billion held across 1,625 companies (571 in energy, 837 in materials and 217 in utilities), held in 1,280 funds. Source: MSCI ESG Research LLC, Burgiss
Among sub-industries, independent non-renewable power generators had the highest emissions
Given the relatively high level of emissions from the utilities sector, it’s likely not surprising that three of the five most carbon-intensive GICS sub-industries belonged to the utilities sector, and none of these five were in the energy sector. As shown in the exhibit below, independent power generation activities using non-renewable sources were responsible for the highest carbon intensity across all sub-industries, estimated at about 5,524 tons/USD million sales. This is more than 4x higher than the utilities-sector average, and 79x the average across all GICS sectors.[3]
Utilities sub-industries were more carbon-intensive than energy or materials

Data as of the third quarter of 2021. This analysis was based on the aggregated underlying holdings’ valuation of USD 231 billion held across 1,625 companies (571 in energy, 837 in materials and 217 in utilities). There were 712 companies in the top and bottom five carbon-intensive sub-industries across the energy, materials and utilities sectors. Source: MSCI ESG Research LLC, Burgiss
Most private asset classes had greater exposure to less carbon-intensive sub-industries
For most private asset classes, the overall valuation share was skewed toward the five least carbon-intensive sub-industries, accounting for 34% of the total energy, materials, and utilities holdings’ valuation, versus the top five’s 10% share. Contrary to the overall allocation outlook, however, real assets had the highest exposure to the top five, which accounted for 15% of the asset class’s valuation in these sectors.
Also notable was private equity, where 48% of the asset class’s valuation in energy, materials and utilities was allocated to the five least carbon-intensive sub-industries, and only 8% to the top five — giving it the lowest carbon footprint among private asset classes.
Real assets were more exposed to carbon-intensive sub-industries than other private asset classes
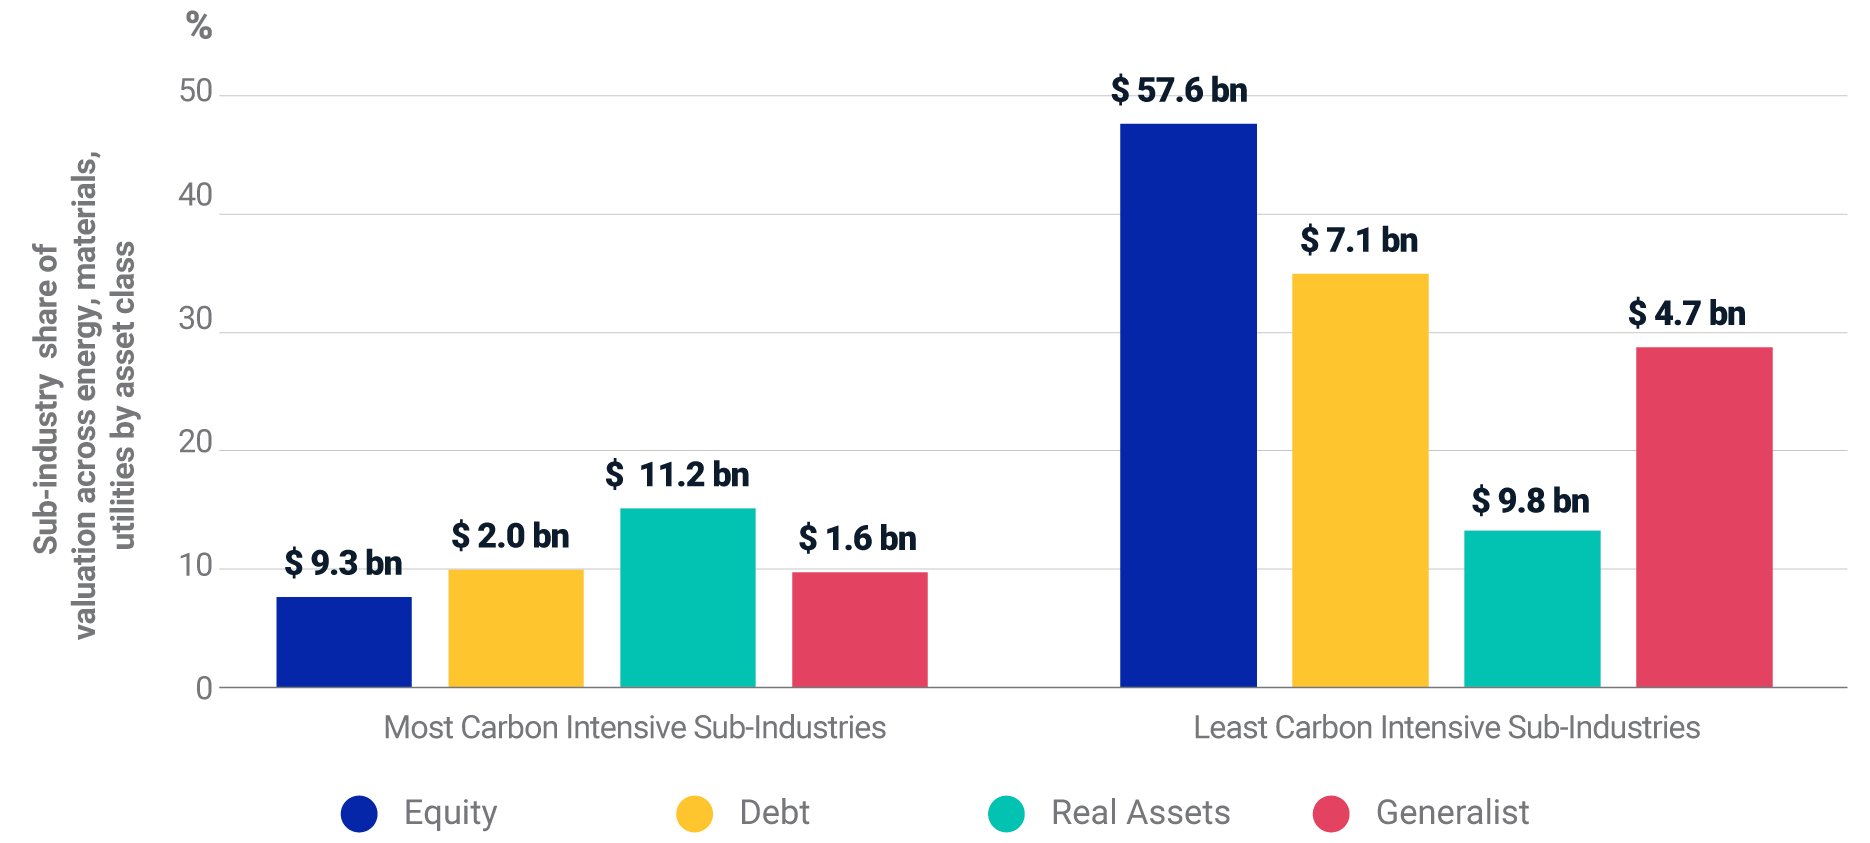
Data as of Q3 2021. This analysis was based on the aggregated underlying holdings’ valuation of USD 231 billion held across 1,625 companies (571 in energy, 837 in materials and 217 in utilities). There were 712 companies in the top and bottom five carbon-intensive sub-industries across the energy, materials and utilities sectors. Source: MSCI ESG Research LLC, Burgiss
Informing engagement decisions
Carbon-reduction targets are becoming an increasingly common topic of discussion between portfolio companies and both general and limited partners. Understanding private capital’s exposure to the energy, materials and utilities sectors, and differentiating the relative weight of emissions across asset classes, may be critical in supporting more-informed risk management and engagement decisions.
References
[1] The underlying valuation of this subset is about USD 231 billion as of third quarter of 2021, representing 6% of the aggregate holdings’ valuation in the Burgiss Manager Universe. Asset class, sector and geography are all attributes that are assigned by Burgiss according to the Burgiss Private Capital Classification System. Asset class is a fund-level field assigned based on where a fund invests its capital. Sector and geography are company-level fields assigned based on the focus and location of the company itself.
[2] GICS is the global industry classification standard jointly developed by MSCI and S&P Global Market Intelligence.
[3] The electricity supply chain consists of three stages: generation, transmission and distribution. Electric utilities have generally been vertically integrated, while independent power producers (also known as nonutility generators) generate electricity to sell in the wholesale electricity market.
Further Reading
New Frontiers in Carbon Footprinting: Private-Equity and Debt Funds
Understanding Carbon Exposure in Private Assets
2022 Private-Asset Trends to Watch
Constructing Climate-Aligned Private Asset Portfolios
Burgiss and MSCI Discuss the Net-Zero Journey for Private Asset Investors