
Open- vs. Closed-End Real Estate Funds: Burgiss and MSCI Joint Research

Open- vs. Closed-End Real Estate Funds: How the Choice Mattered
Bryan Reid - Executive Director, MSCI Research; Luis O’Shea - Director, Burgiss; Bert Teuben - Executive Director, MSCI Research
The aggregate performance of closed- and open-end real estate funds in the U.S. was strikingly similar in recent years, despite large differences in their strategic focus and the roles they play in institutional portfolios.
How investors timed their commitments to closed-end funds, as well as how managers drew down and returned capital to investors, contributed toward money-weighted returns that were 2 percentage points higher than their equivalent time-weighted returns.
Performance dispersion across closed-end funds created opportunity for investors able to select top-quartile managers, but even those making a large number of commitments potentially faced a wide range of portfolio returns.
Closed-end real estate funds may employ varied approaches from fund to fund, but, typically, they all employ very different strategies from those of open-end funds. Despite that, their aggregate performance has been strikingly similar to open-end funds’ performance in the U.S. Important differences underlie the aggregate performance, however, and closed-end-fund investors’ outcomes are unlikely to be average. The timing of cash flows into and out of funds can significantly impact performance; and, for the funds in our analysis, these timing dynamics appear to have had a positive impact overall, during our study period. The aggregate result also masked a wide performance variation across individual closed-end funds. We used a simulation to demonstrate that even investors who make commitments to many closed-end real estate funds may still face a wide range of potential portfolio outcomes, so fund selection mattered.
Surprisingly Similar Returns
One avenue for investors to access private real estate is through pooled unlisted funds. These provide more diversification than direct investing and are less exposed to market volatility than listed real estate. Pooled vehicles can be subdivided into open-end and closed-end funds. Due to their finite life span, closed-end funds are often used as a vehicle for more active, value-add or opportunistic strategies that focus on maximizing capital growth of assets over predetermined business plans. Open-end funds typically seek to provide a more diversified, perennial, income-focused exposure to the asset class. Despite these differences, our analysis shows performance between these fund groups has been strikingly similar at the aggregate level, suggesting they may have more in common than some investors assume and highlighting the importance of the common, underlying real-estate-market drivers of performance.
The exhibit below illustrates this by comparing the performance of open-end funds from the MSCI/PREA U.S. AFOE Quarterly Property Fund Index to U.S. closed-end funds from the Burgiss Manager Universe dataset.1 When we compare the rolling 12-month time-weighted total returns, we find some differentiation, but overall the trends have been remarkably similar. The annualized time-weighted total return for closed-end funds over this period was 3.2% — and 4.0% for open-end funds.
Aggregate Performance of U.S. Closed- and Open-End Funds Was Similar in Recent Years
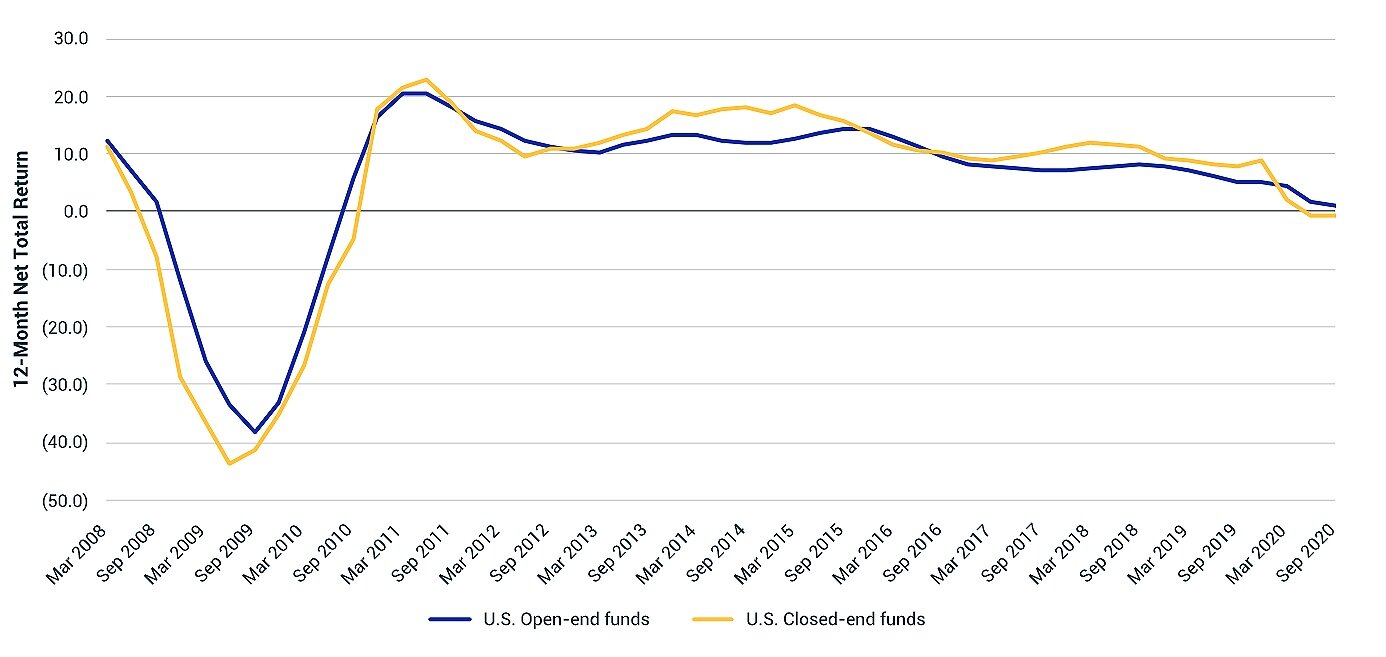
Source: Burgiss, MSCI
Similarity in aggregate performance did, however, mask a significant difference in the dispersion of individual fund returns between open- and closed-end funds. While results varied over time, looking, for example, at a five-year measurement period from 2015 to 2020, the 5th-to-95th-percentile spread in time-weighted returns for closed-end funds was 29%, compared to only 5% for open-ended funds, even after screening for closed-end funds with low levels of committed capital invested. Closed-end funds also had a wide dispersion (26%) during the first five years of the time period. Open-end funds, though more widely dispersed than at the end of the period, were still much less so (9%) than the closed-end funds.2
Investment Timing Was Key for Closed-End Funds
The exhibit above shows how similar the aggregate-performance trends were on a time-weighted basis, which is appropriate and useful for cross-asset-class comparisons, but it does not provide full insight into how investment-timing dynamics impacted closed-end investors. Managers of closed-end funds draw down capital as investment opportunities arise and return it to investors as asset strategies are realized. As a result, the proportion of committed capital employed varies over the life of a fund. Open-end funds are generally pressured to quickly invest capital from new subscriptions to avoid cash drag — and similarly to return capital to investors as soon as possible after a redemption request is made. This is one of a number of reasons the performance of open- and closed-end funds has traditionally been measured differently. Using internal rate of return (IRR) to measure the money-weighted returns of the same closed-end funds over the same period (as in the exhibit above) yields a result of 5.25%, a 2-percentage-point premium over the time-weighted result of 3.2%.
A way to account for such timing differences on a like-for-like basis is to evaluate the performance of the closed-end funds in our analysis against the MSCI/PREA U.S. AFOE Quarterly Property Fund Index using measures like the Kaplan Schoar public-market equivalent (KS-PME)3 and direct alpha.4 The KS-PME is a cash multiple. Like total value to paid-in capital, it compares distributions and net asset value in the numerator to contributions in the denominator, but cash flows are discounted using the reference index. In this example, we can think of closed-end-fund performance as a multiple of the performance of an alternative series of investments in the open-end-fund index, where the quantum and timing of those investments are aligned with those of the closed-end-fund portfolio. A result greater than 1 indicates outperformance of the reference index, while a reading below 1 corresponds to underperformance. Direct alpha is related to the KS-PME, but quantifies the out- or underperformance as an annualized rate of return; so if its value is positive, the investment has outperformed the reference index.
The results varied considerably across individual funds over the study period, but the pooled performance of all the closed-end funds across the 2008 to 2020 vintages yields a KS-PME of 1.08 and a direct alpha of 2.6%, suggesting that closed-end funds outperformed on a money-weighted basis. These results and the similarity in the aggregate-total-return trends shown in the first exhibit suggest that, at an aggregate level, investment timing had a positive impact for the closed-end funds in our analysis.
Achieving Market Returns Through Closed-End Funds Took Strong ‘Commitment’
For individual closed-end real estate funds, the range of performance outcomes can be very broad. For example, the since-inception pooled IRR of the 504 U.S. closed-end real estate funds with vintages between 2008 and 2020 from the Burgiss Manager Universe dataset was 11.27% at the aggregate level, but for the 95th percentile it was 24.2% and for the 5th percentile -19.0%.5
To test how diversification may have affected closed-end real estate portfolios, we constructed a Monte Carlo simulation that uses data from the same 504 closed-end funds to evaluate how the range of expected portfolio IRRs changes as the number of commitments per vintage increases. The exhibit below shows the spread of IRRs for simulated investment portfolios assuming different numbers of fund commitments every year. The results show that, unsurprisingly, simulated portfolios with relatively few commitments per year over the investment period faced a much wider range of expected returns than simulated portfolios with more commitments per year, but that even investors who made a very large number of commitments each year still may have faced a relatively wide range of potential returns.
Data from Burgiss further suggests that investors who have made commitments to closed-end funds in recent years (the number of commitments per year for a typical investor has ranged between one and four) can expect considerable variation in performance outcomes. Looking at the results of our simulation, the 5th-to-95th-percentile range for portfolios of one commitment per vintage was 11.3 percentage points. With four commitments per vintage, this performance dispersion declined by more than half but remained relatively high at 5.5 percentage points, suggesting fund selection can significantly influence portfolio performance.
Diversification May Be Challenging for Closed-End Investors, so Fund Selection Mattered

Simulated portfolios consisted of one or more commitments of equal size across all vintages from 2008 to 2020, and individual funds have an equal selection probability. Source: Burgiss
It’s All in the Execution
Given the distinct nature of closed-end real estate funds, some investors may be surprised by how similar their aggregate-return trends have been to those of open-end funds in recent years. The result does highlight the commonality of underlying return drivers between both types of funds. It may be tempting to conclude from the aggregated performance trends that the allocation decision between open- and closed-end funds doesn’t matter, but based on our analysis, the selection of individual commitments and the timing of their deployment throughout the funds’ lives were important variables for investors using closed-end funds to construct real estate portfolios. The performance of even large closed-end portfolios that make several fund commitments per year can vary significantly from market aggregates used in strategic allocation decisions.
1 Closed-end returns calculated based on 811 U.S. real estate funds, including pre-2008 vintages, as of Sept. 30, 2020.
2 We filtered closed-end funds to maximize sample size, while controlling for vintage and proportion of committed capital invested. Only closed-end funds with at least 30% of committed capital invested throughout the period were selected. For the analysis period of the five years to September 2020, 85 closed-ended funds and 33 open-end funds satisfied the filter criteria. For the five years to December 2012, 78 closed-ended funds and 25 open-end funds satisfied the filter criteria.
3 Kaplan, Steve, and Antoinette Schoar. 2005. “Private Equity Performance: Returns, Persistence, and Capital Flows.” Journal of Finance.
4 Gredil, Oleg, Barry E. Griffiths, and Rüdiger Stucke, 2014. “Benchmarking Private Equity: The Direct Alpha Method.” SSRN.
5 Figures calculated based on 504 U.S. closed-end real estate funds with vintages from 2008 to 2020, as of Sept. 30, 2020.