
Climate Transition Risk, Part Two: An Upstream Approach
Abdulla Zaid*, Burgiss
This research brief is Part Two of the Climate Transition Risk blog series. Read Part One: An Introduction here.
Key Takeaways:
In the case of a carbon price, carbon-intensive private companies showed a substantially more pronounced reaction to energy shocks than other private companies.
A carbon price of 75 USD per tonne CO2 may, on average, result in a 3.10 percentage point decline in the EBITDA (earnings before interest, taxes, depreciation, and amortization) margins of U.S. carbon-intensive private companies, compared to only 0.95 percentage points for the non-carbon-intensive companies.
The previous article provided a materiality map for greenhouse gas (GHG) emissions within U.S. private companies held by Buyout funds. This article will utilize the GHG emission materiality map as an analytical framework to estimate climate transition risks from fossil fuel combustion[1] using the upstream approach. This approach assumes that a carbon price is applied at the time of fossil fuel extraction or distribution, where pricing depends on the carbon content. Energy companies may fully or partially transfer that cost to energy buyers, which could increase costs and squeeze EBITDA margins.
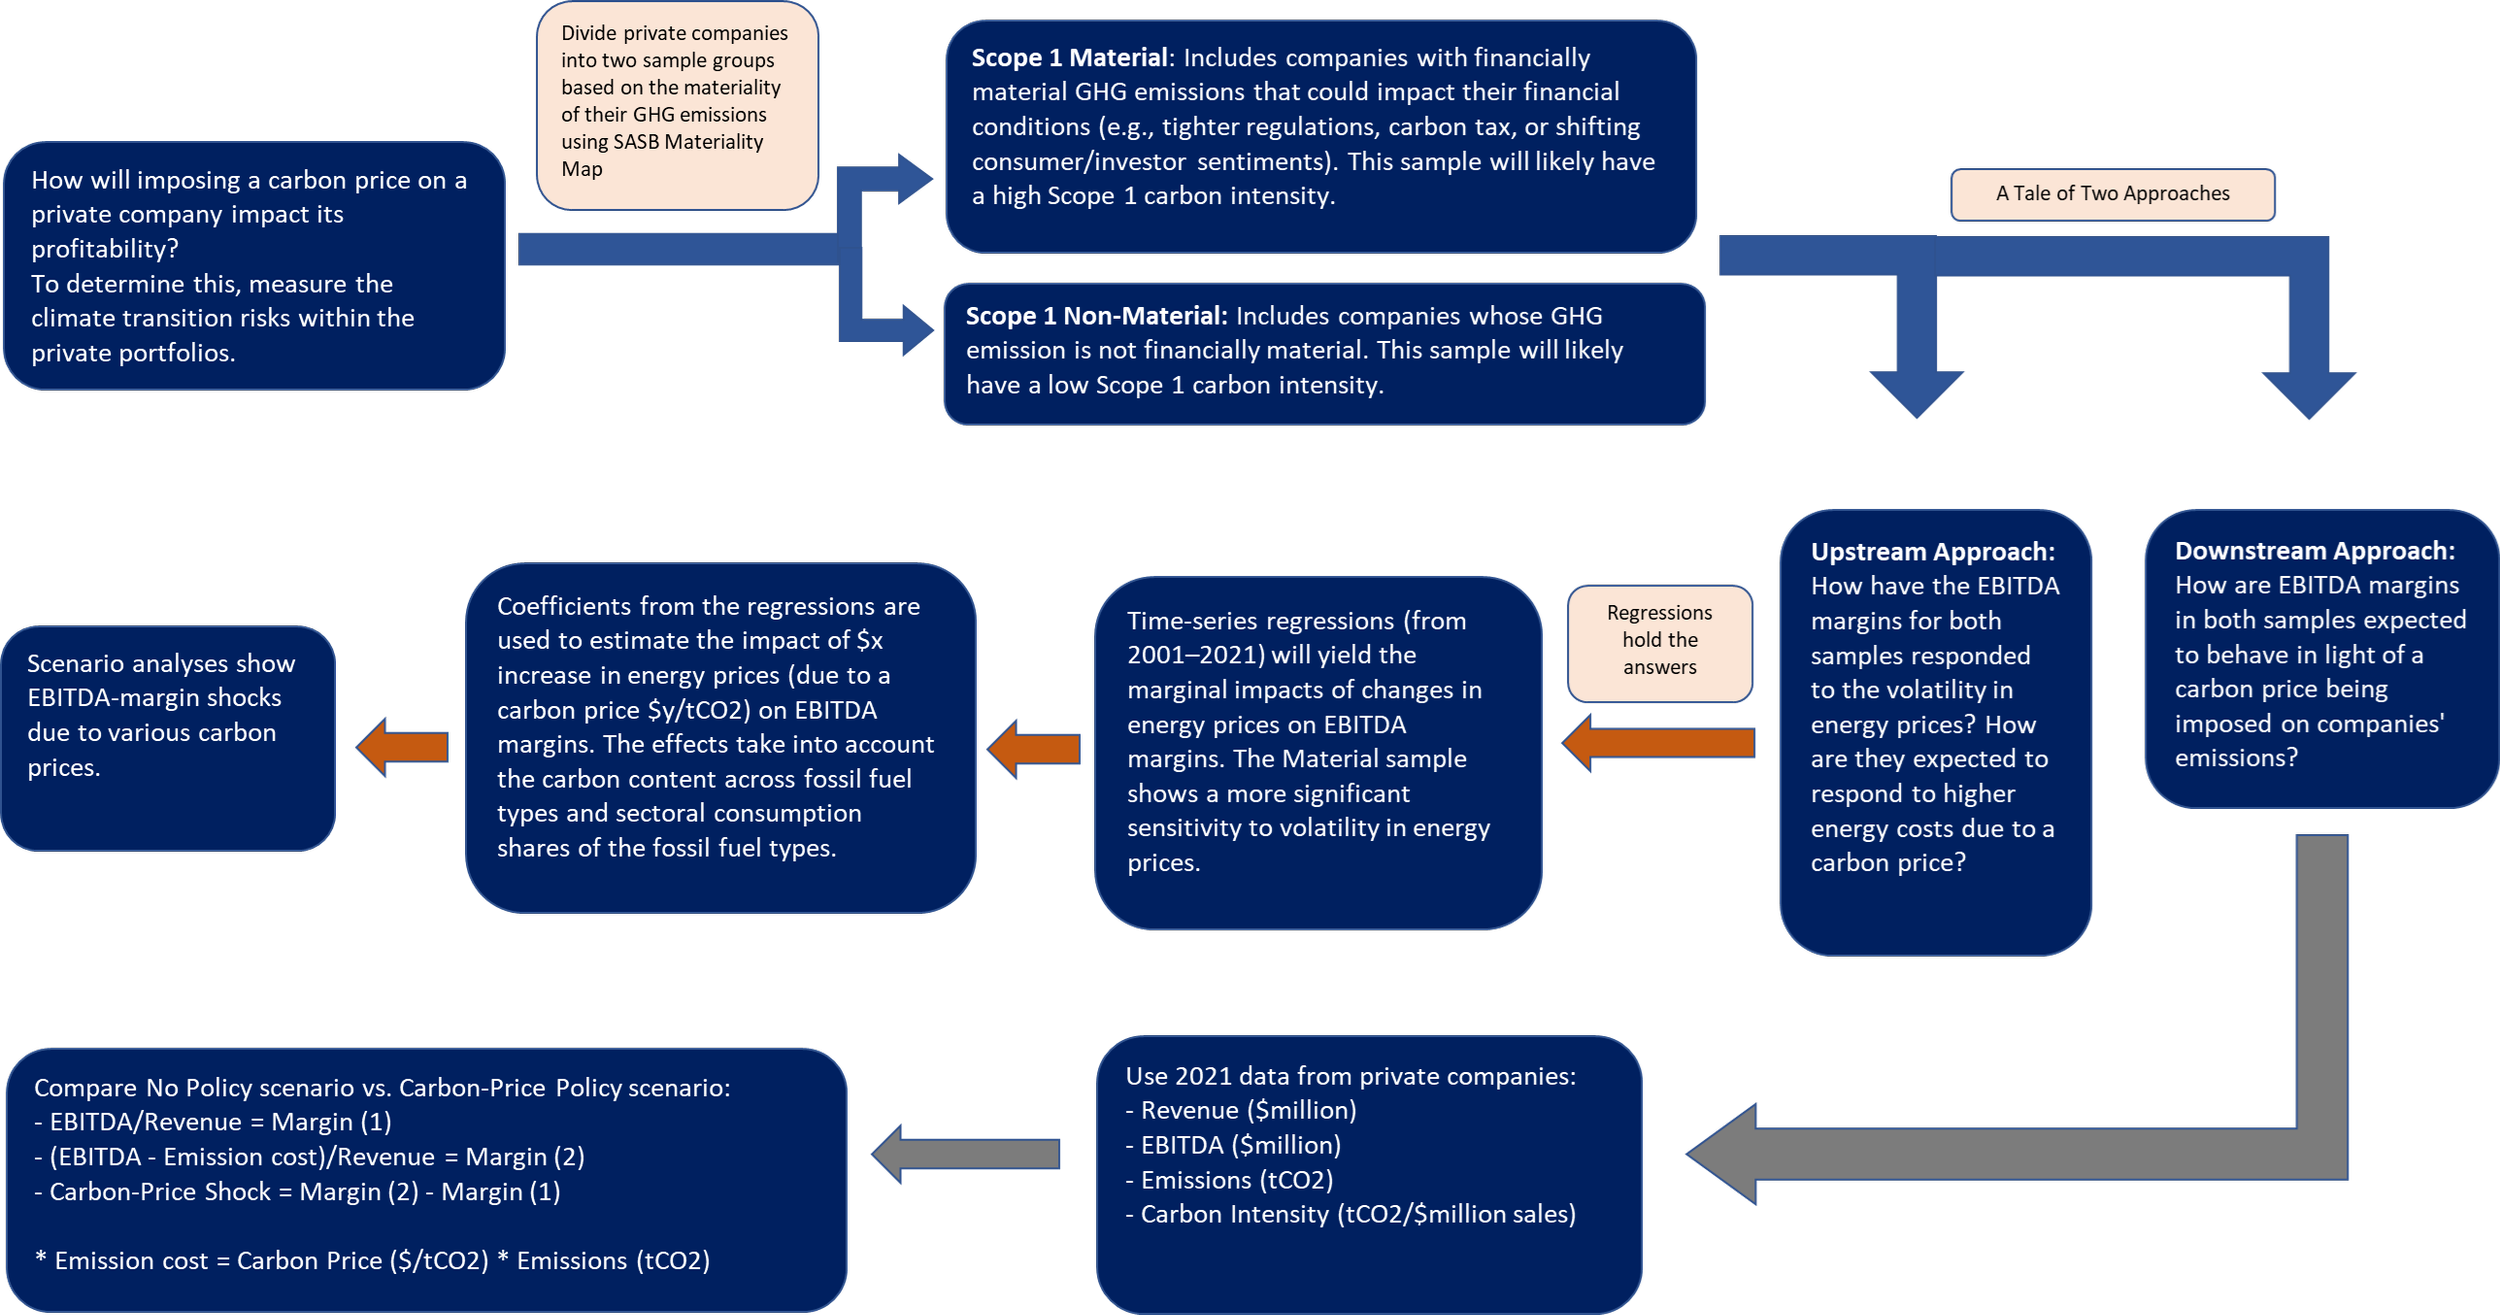
Figure 1: Methodology Summary
Carbon Price Policy: Getting the Least Carbon for the Buck
When it comes to climate policymaking, carbon pricing is increasingly implemented as an actionable policy tool to meet emissions reduction targets. Carbon pricing, either through a carbon tax or an Emission Trading System (ETS), is already adopted in 46 national and 36 subnational jurisdictions (including U.S. states[2]), covering about 23% of the global GHG emissions.[3]
Given the looming climate policy changes, companies—especially in energy, materials, and financial services—are increasingly setting an internal carbon price as a tool to gauge how, where, and when emissions could impact profitability and investment strategies.[4]
Profitability During Volatile Energy Prices: Does GHG Emission Materiality Matter?
Estimating climate transition risks requires an understanding of GHG emissions at the company level, and whether it is significant enough to materially impact the company’s bottom line. As demonstrated in the previous article, the first step is to divide the sample of private companies into “material” and “non-material” subsets based on the SASB financial materiality of their direct GHG emissions (scope 1).[5]
From a fossil fuel buyer’s perspective,[6] a climate policy may lead to a higher energy cost, reflecting the introduction of a carbon price. Therefore, companies that rely on fossil fuel in production, and are also responsible for significant GHG emissions, may face increasing energy costs and shrinking margins, possibly placing a downward pressure on long-term enterprise value. Looking through the past decade, figure 2 shows just that—the last twelve months (LTM) pooled EBITDA margins of the material subset show a more persistently negative correlation with fossil fuel prices than what is exhibited by the non-material subset. This demonstrates the varying levels of sensitivity to energy shocks among private companies and offers a test drive of how margins could behave in light of a carbon tax. Figure 2 below shows the 5-year rolling correlation between EBITDA margins and energy prices for both samples – material and non-material.


Figure 2: Energy Pains on Private Companies’ Balance Sheets
5-year rolling correlation between EBITDA margins and fossil fuel energy prices. Data on LTM pooled EBITDA margins as of Q2 2022, based on 6,933 unique U.S. portfolio companies in Buyout funds, from December 2001 to December 2021 (Burgiss). Correlations use data on natural gas prices for industrial uses (U.S. Energy Information Administration [EIA]) and gasoline prices (EIA). Fossil fuel energy producers are excluded from the analysis, as the focus is only on energy buyers/consumers.
Sources: LTM pooled EBITDA margins data from Burgiss; Natural gas prices from U.S. Energy Information Administration (EIA): https://www.eia.gov/dnav/ng/ng_pri_sum_dcu_nus_m.htm;
gasoline prices are from EIA: http://www.eia.gov/dnav/pet/pet_pri_gnd_a_epm0_pte_dpgal_a.htm.
Measuring Climate Transition Risks at Various Carbon-Price Scenarios
This article uses time series models to examine the historical impact of energy price shocks on EBITDA margins, after controlling for economic conditions (data from 2001–2021). Regression results[7] on the two samples—material and non-material—provide insights into how U.S. private companies’ profitability may react to an increase in energy prices due to a change in carbon prices. The central finding suggests that private companies’ margins within the material subset showed a substantially more pronounced reaction to energy shocks than those in the non-material segment.
For instance, at a 75 USD per tonne CO2 (carbon-price level recommended by the International Monetary Fund [IMF] by 2030 to limit global warming to 1.5°C – 2°C or 2.7°F – 3.6°F)[8], EBITDA margin is estimated to fall by ~3.10 percentage points for companies within the material subset, compared to ~0.95 percentage points in the case of the non-material group, holding other factors constant. The divergence between the two samples appears to amplify the different levels of dependency on fossil fuel for their primary business activities and their subsequent vulnerability toward a carbon price. Given that carbon-intensive companies – mostly concentrated in resource transformation, extractives, and power generation – are among the primary users of fossil fuel, a carbon price may send a shock wave through the energy markets which could increase costs and erode earnings. Figure 3 outlines the estimated losses in EBITDA margins in both segments, under various carbon-price scenarios.

Figure 3: Scenario Analysis at Various Carbon Prices
The modeled EBITDA margin shocks depend on the fossil fuel mix and sector weights within the sample. Fossil fuel weights utilize energy consumption data from EIA: https://www.eia.gov/energyexplained/us-energy-facts/images/consumption-by-source-and-sector.pdf. Carbon-price scenarios and calculations are based on heat content and CO2 factor data from the U.S. Environmental Protection Agency (EPA): https://www.epa.gov/system/files/documents/2022-04/ghg_emission_factors_hub.pdf. Natural gas prices are from EIA: https://www.eia.gov/dnav/ng/ng_pri_sum_dcu_nus_m.htm; gasoline prices are from EIA: http://www.eia.gov/dnav/pet/pet_pri_gnd_a_epm0_pte_dpgal_a.htm. Regression tables in appendix. To the right, each box denotes the 25th, 50th, and 75th quantile of margins for each sample across all years, while the whiskers represent the 5th and 95th percentiles.
Source: Burgiss
Informing engagement pathways
Measuring climate transition risks is an increasingly common topic of discussion within the Limited Partner circles. Understanding private capital’s exposure to GHG emission regulatory risks and identifying financial materiality in a private portfolio may be critical in supporting more informed engagement efforts and climate risk management practices.
Implementing a carbon price using the upstream approach is effective in two ways: it offers a wide coverage of the carbon-intensive economy and, at the same time, minimizes policy and administrative costs due to the limited number of energy suppliers. The challenge is in the economy-wide shock that comes with this approach and the associated uncertainty and risk to the macroeconomic outlook. The downstream approach emerges as a practical and gradual alternative, putting the emission costs directly on the emitting companies. The next article will discuss this approach and estimate the cost burden on private companies.
The author thanks Shailesh Khadka and Daniel Hadley from Burgiss for their contributions to this research brief.
[1] This article does not explicitly examine the impact of electricity cost on profitability, which will be addressed as part of scope 2 materiality analysis in future publications.
[2] Several U.S. states have enacted carbon-pricing schemes: RGGI (Connecticut, Delaware, Maine, Maryland, Massachusetts, New Hampshire, New Jersey, New York, Rhode Island, Vermont, and Virginia), California, and Washington (voted for 2023). Market-Based State Policy. Center for Climate and Energy Solutions. https://www.c2es.org/content/market-based-state-policy/
[3] Carbon Pricing Dashboard. World Bank. https://carbonpricingdashboard.worldbank.org/
[4] Fan, Jessica, Rehm, Werner, Siccardo, Giulia. The state of internal carbon pricing. McKinsey. February 10,2021. https://www.mckinsey.com/capabilities/strategy-and-corporate-finance/our-insights/the-state-of-internal-carbon-pricing
[5] Scope 1 emissions are direct greenhouse emissions from sources controlled or owned by an entity. GHG Protocol.
[6] Fossil fuel energy producers are excluded from the analysis, as the focus is only on energy buyers/consumers.
[7] The marginal effects of fossil-fuel prices on EBITDA margins were found statistically significant for the material subset (across all fossil-fuel types). Although the non-material segment also had an inverse relationship with energy prices, the marginal effects were smaller in magnitude and statistically insignificant, which demonstrates their lower sensitivity to energy shocks compared to the material segment. Regression tables are in the Appendix.
[8] Launch of IMF Staff Climate Note: A Proposal for an International Carbon Price Floor Among Large Emitters. IMF. June 18, 2021. https://www.imf.org/en/News/Articles/2021/06/18/sp061821-launch-of-imf-staff-climate-note